前置き
監視をZabbixに切り替えるまではNagios+Cactiっていう環境だったが、管理は1台でアクセスもそんなに無いとくれば、とくに何も起こらないので残念ながらあまり印象にない・・・。
毎晩グラフの確認をしていつも通りのふにゃふにゃ具合だったら確認よし!としていた。
そんなnagiosです。
インストール
事前の用意はないのでNagiosを実験環境にインストールしようか。
さぁ実験ですよ。
rpmforgeだとちょっと古いらしいので、epelからインストールします。
rpmforgeでのNagiosのバージョン
nagios x86_64 3.2.3-3.el6.rfepelでのNagiosのバージョン
nagios x86_64 3.5.1-1.el6プラグインの数もepelの方が多いですね。というかrpmforgeだと全然ないです。
# yum --enablerepo=epel install nagios nagios-plugins nagios-plugins-allグラフ描画に必要なGDをインストール。
# yum -y install gd-devel設定ファイルはNagiosの場合はどこかからcpする訳でもなくインストールすれば/etc以下にある。
vi /etc/nagios/nagios.cfgコメントアウト以外を出力してみると結構項目が多いようで。
# egrep -v "^\s*$|^#" /etc/nagios/nagios.cfg |
 log_file=/var/log/nagios/nagios.log
 cfg_file=/etc/nagios/objects/commands.cfg
 cfg_file=/etc/nagios/objects/contacts.cfg
 cfg_file=/etc/nagios/objects/timeperiods.cfg
 cfg_file=/etc/nagios/objects/templates.cfg
 cfg_file=/etc/nagios/objects/localhost.cfg
 cfg_dir=/etc/nagios/conf.d
 object_cache_file=/var/log/nagios/objects.cache
 precached_object_file=/var/log/nagios/objects.precache
 resource_file=/etc/nagios/private/resource.cfg
 status_file=/var/log/nagios/status.dat
 status_update_interval=10
 nagios_user=nagios
 nagios_group=nagios
 check_external_commands=1
 command_check_interval=-1
 command_file=/var/spool/nagios/cmd/nagios.cmd
 external_command_buffer_slots=4096
 lock_file=/var/run/nagios.pid
 temp_file=/var/log/nagios/nagios.tmp
 temp_path=/tmp
 event_broker_options=-1
 log_rotation_method=d
 log_archive_path=/var/log/nagios/archives
 use_syslog=1
 log_notifications=1
 log_service_retries=1
 log_host_retries=1
 log_event_handlers=1
 log_initial_states=0
 log_external_commands=1
 log_passive_checks=1
 service_inter_check_delay_method=s
 max_service_check_spread=30
 service_interleave_factor=s
 host_inter_check_delay_method=s
 max_host_check_spread=30
 max_concurrent_checks=0
 check_result_reaper_frequency=10
 max_check_result_reaper_time=30
 check_result_path=/var/log/nagios/spool/checkresults
 max_check_result_file_age=3600
 cached_host_check_horizon=15
 cached_service_check_horizon=15
 enable_predictive_host_dependency_checks=1
 enable_predictive_service_dependency_checks=1
 soft_state_dependencies=0
 auto_reschedule_checks=0
 auto_rescheduling_interval=30
 auto_rescheduling_window=180
 sleep_time=0.25
 service_check_timeout=60
 host_check_timeout=30
 event_handler_timeout=30
 notification_timeout=30
 ocsp_timeout=5
 perfdata_timeout=5
 retain_state_information=1
 state_retention_file=/var/log/nagios/retention.dat
 retention_update_interval=60
 use_retained_program_state=1
 use_retained_scheduling_info=1
 retained_host_attribute_mask=0
 retained_service_attribute_mask=0
 retained_process_host_attribute_mask=0
 retained_process_service_attribute_mask=0
 retained_contact_host_attribute_mask=0
 retained_contact_service_attribute_mask=0
 interval_length=60
 check_for_updates=1
 bare_update_check=0
 use_aggressive_host_checking=0
 execute_service_checks=1
 accept_passive_service_checks=1
 execute_host_checks=1
 accept_passive_host_checks=1
 enable_notifications=1
 enable_event_handlers=1
 process_performance_data=0
 obsess_over_services=0
 obsess_over_hosts=0
 translate_passive_host_checks=0
 passive_host_checks_are_soft=0
 check_for_orphaned_services=1
 check_for_orphaned_hosts=1
 check_service_freshness=1
 service_freshness_check_interval=60
 service_check_timeout_state=c
 check_host_freshness=0
 host_freshness_check_interval=60
 additional_freshness_latency=15
 enable_flap_detection=1
 low_service_flap_threshold=5.0
 high_service_flap_threshold=20.0
 low_host_flap_threshold=5.0
 high_host_flap_threshold=20.0
 date_format=us
 p1_file=/usr/sbin/p1.pl
 enable_embedded_perl=1
 use_embedded_perl_implicitly=1
 illegal_object_name_chars=`~!$%^&*|'"<>?,()=
 illegal_macro_output_chars=`~$&|'"<>
 use_regexp_matching=0
 use_true_regexp_matching=0
 admin_email=nagios@localhost
 admin_pager=pagenagios@localhost
 daemon_dumps_core=0
 use_large_installation_tweaks=0
 enable_environment_macros=1
 debug_level=0
 debug_verbosity=1
 debug_file=/var/log/nagios/nagios.debug
 max_debug_file_size=1000000
Apacheがincludeしているファイルを見てみます。
# egrep -v "^\s*$|^#" /etc/httpd/conf.d/nagios.conf
ScriptAlias /nagios/cgi-bin/ "/usr/lib64/nagios/cgi-bin/"
<Directory "/usr/lib64/nagios/cgi-bin/">
  Options ExecCGI
  AllowOverride None
  Order allow,deny
  Allow from all
  AuthName "Nagios Access"
  AuthType Basic
  AuthUserFile /etc/nagios/passwd
  Require valid-user
</Directory>
Alias /nagios "/usr/share/nagios/html"
<Directory "/usr/share/nagios/html">
  Options None
  AllowOverride None
  Order allow,deny
  Allow from all
  AuthName "Nagios Access"
  AuthType Basic
  AuthUserFile /etc/nagios/passwd
  Require valid-user
</Directory>
管理ユーザーのパスワードだけつけておきます。
# htpasswd /etc/nagios/passwd nagiosadmin
New password:
Re-type new password:
Updating password for user nagiosadmin
ひとまず起動して、WEBの管理画面を見てみますと
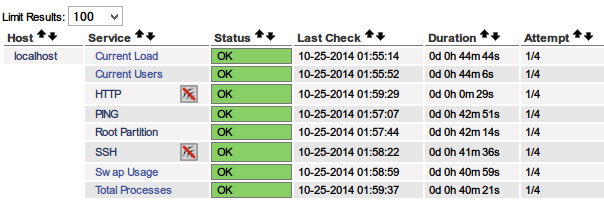
何もせずともデフォルトでこれだけの監視は入ってます。
監視のこと
監視のファイルはどこぞにあるのか??
/etc/nagios/objects/commands.cfg です。
# cat /etc/nagios/objects/commands.cfg | head -157 | tail -20
define command{
   command_name    check_snmp
   command_line    $USER1$/check_snmp -H $HOSTADDRESS$ $ARG1$
   }


# 'check_http' command definition
define command{
   command_name    check_http
   command_line    $USER1$/check_http -I $HOSTADDRESS$ $ARG1$
   }


# 'check_ssh' command definition
define command{
   command_name    check_ssh
   command_line    $USER1$/check_ssh $ARG1$ $HOSTADDRESS$
   }
これだけだと何だかよく分かりません。$HOSTADDRESSやらは環境変数ではなくて
/etc/nagios/objects/localhost.cfgここに記述されています。さきほどのcommands.cfgとはセットですね。
プラグインを入れておけば、ここで色々と設定を追加すればOKみたいですね。
どれだけあるのかというと、epelで入れているならこんな感じかと。
# ls /usr/lib64/nagios/plugins
check_breeze    check_fping      check_load         check_ntp.pl    check_sensors  check_users
check_by_ssh    check_ftp        check_log          check_ntp_peer  check_simap    check_wave
check_clamd     check_game       check_mailq        check_ntp_time  check_smtp     eventhandlers
check_cluster   check_hpjd       check_mrtg         check_nwstat    check_snmp     negate
check_dhcp      check_http       check_mrtgtraf     check_oracle    check_spop     urlize
check_dig       check_icmp       check_mysql        check_overcr    check_ssh      utils.pm
check_disk      check_ide_smart  check_mysql_query  check_pgsql     check_ssmtp    utils.sh
check_disk_smb  check_imap       check_nagios       check_ping      check_swap
check_dns       check_ircd       check_nntp         check_pop       check_tcp
check_dummy     check_jabber     check_nntps        check_procs     check_time
check_file_age  check_ldap       check_nt           check_real      check_udp
check_flexlm    check_ldaps      check_ntp          check_rpc       check_ups
記述は-hで確認できます。
# /usr/lib64/nagios/plugins/check_mysql -h
check_mysql v1.4.16 (nagios-plugins 1.4.16)
Copyright (c) 1999-2007 Nagios Plugin Development Team
   <nagiosplug-devel@lists.sourceforge.net>

This program tests connections to a MySQL server


Usage:
 check_mysql [-d database] [-H host] [-P port] [-s socket]
   [-u user] [-p password] [-S]

Options:
 -h, --help
  Print detailed help screen
 -V, --version
  Print version information
監視を追加したい時はさっき書いた通り
/etc/nagios/objects/commands.cfg
/etc/nagios/objects/localhost.cfg
この2個のファイル両方ともに追加の記述が必要なのですだ。
試しにMySQLを増やしてみましんす。
# 'check_mysql' command definition
define command{
   command_name    check_mysql
   command_line    $USER1$/check_mysql -H $HOSTADDRESS$ -u $ARG1$
   }
引数にアドレス、ユーザー名を取らせます。※パスワード設定していないので。
# Define a service to check MYSQL on the local machine.
define service{
   use                             generic-service
   host_name                       localhost
   service_description             MySQL
   check_command                   check_mysql!root
   }
service nagios restart してWEBを見てみます。
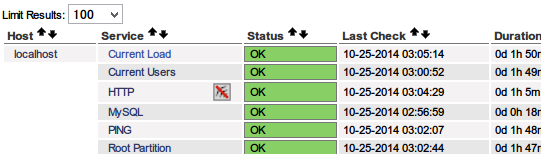
HTTPの下にMySQLが追加されました。
その他いろいろ
パス
# egrep -v "^\s*$|^#" /etc/nagios/private/resource.cfg
$USER1$=/usr/lib64/nagios/plugins
メール関連
# egrep -v "^\s*$|^#" /etc/nagios/objects/contacts.cfg
define contact{
   contact_name                    nagiosadmin             ; Short name of user
   use                             generic-contact         ; Inherit default values from generic-contact template (defined above)
   alias                           Nagios Admin            ; Full name of user
   email                           nagios@localhost        ; <<***** CHANGE THIS TO YOUR EMAIL ADDRESS ******
   }
define contactgroup{
   contactgroup_name       admins
   alias                   Nagios Administrators
   members                 nagiosadmin
   }
CGI
# egrep -v "^\s*$|^#" /etc/nagios/cgi.cfg
main_config_file=/etc/nagios/nagios.cfg
physical_html_path=/usr/share/nagios/html
url_html_path=/nagios
show_context_help=0
use_pending_states=1
use_authentication=1
use_ssl_authentication=0
authorized_for_system_information=nagiosadmin
authorized_for_configuration_information=nagiosadmin
authorized_for_system_commands=nagiosadmin
authorized_for_all_services=nagiosadmin
authorized_for_all_hosts=nagiosadmin
authorized_for_all_service_commands=nagiosadmin
authorized_for_all_host_commands=nagiosadmin
default_statusmap_layout=5
default_statuswrl_layout=4
ping_syntax=/bin/ping -n -U -c 5 $HOSTADDRESS$
refresh_rate=90
result_limit=100
escape_html_tags=1
action_url_target=_blank
notes_url_target=_blank
lock_author_names=1
その他のconfファイル
# ls /etc/nagios/objects/
commands.cfg  localhost.cfg  switch.cfg     timeperiods.cfg
contacts.cfg  printer.cfg    templates.cfg  windows.cfg
たまーに重箱の隅系の問題が出題されるので、色々見ておくのがいいね。
プロセスはnagios.confで指定している通りです。
nagios_user=nagios
nagios_group=nagios
nagios    7613  0.0  0.1 138176  2060 ?        Ssl  02:39   0:01 /usr/sbin/nagios -d /etc/nagios/nagios.cfg
nagiostats
ダジャレ気味ですが、CLIでの状態確認コマンドもあり、以下のように出力されます。
# nagiostats

Nagios Stats 3.5.1
Copyright (c) 2003-2008 Ethan Galstad (www.nagios.org)
Last Modified: 08-30-2013
License: GPL

CURRENT STATUS DATA
------------------------------------------------------
Status File:                            /var/log/nagios/status.dat
Status File Age:                        0d 0h 0m 7s
Status File Version:                    3.5.1

Program Running Time:                   0d 0h 58m 27s
Nagios PID:                             7613
Used/High/Total Command Buffers:        0 / 0 / 4096

Total Services:                         9
Services Checked:                       9
Services Scheduled:                     9
Services Actively Checked:              9
Services Passively Checked:             0
Total Service State Change:             0.000 / 11.050 / 1.644 %
Active Service Latency:                 0.017 / 0.215 / 0.113 sec
Active Service Execution Time:          0.004 / 4.015 / 0.455 sec
Active Service State Change:            0.000 / 11.050 / 1.644 %
Active Services Last 1/5/15/60 min:     1 / 9 / 9 / 9
Passive Service Latency:                0.000 / 0.000 / 0.000 sec
Passive Service State Change:           0.000 / 0.000 / 0.000 %
Passive Services Last 1/5/15/60 min:    0 / 0 / 0 / 0
Services Ok/Warn/Unk/Crit:              9 / 0 / 0 / 0
Services Flapping:                      0
Services In Downtime:                   0

Total Hosts:                            1
Hosts Checked:                          1
Hosts Scheduled:                        1
Hosts Actively Checked:                 1
Host Passively Checked:                 0
Total Host State Change:                0.000 / 0.000 / 0.000 %
Active Host Latency:                    0.037 / 0.037 / 0.037 sec
Active Host Execution Time:             4.009 / 4.009 / 4.009 sec
Active Host State Change:               0.000 / 0.000 / 0.000 %
Active Hosts Last 1/5/15/60 min:        1 / 1 / 1 / 1
Passive Host Latency:                   0.000 / 0.000 / 0.000 sec
Passive Host State Change:              0.000 / 0.000 / 0.000 %
Passive Hosts Last 1/5/15/60 min:       0 / 0 / 0 / 0
Hosts Up/Down/Unreach:                  1 / 0 / 0
Hosts Flapping:                         0
Hosts In Downtime:                      0

Active Host Checks Last 1/5/15 min:     0 / 1 / 3
  Scheduled:                           0 / 1 / 3
  On-demand:                           0 / 0 / 0
  Parallel:                            0 / 1 / 3
  Serial:                              0 / 0 / 0
  Cached:                              0 / 0 / 0
Passive Host Checks Last 1/5/15 min:    0 / 0 / 0
Active Service Checks Last 1/5/15 min:  2 / 8 / 25
  Scheduled:                           2 / 8 / 25
  On-demand:                           0 / 0 / 0
  Cached:                              0 / 0 / 0
Passive Service Checks Last 1/5/15 min: 0 / 0 / 0

External Commands Last 1/5/15 min:      0 / 0 / 0
参考書籍
LPI level3 問題集 株式会社ソキウスジャパン 金沢 泳義 (著), 菖蒲 淳司 (著), 森嶋 秀樹 (監修)